SEO Reporting Dashboards: The Complete 2026 Guide to Metrics, Tools & AI Visibility

 Summarize in ChatGPT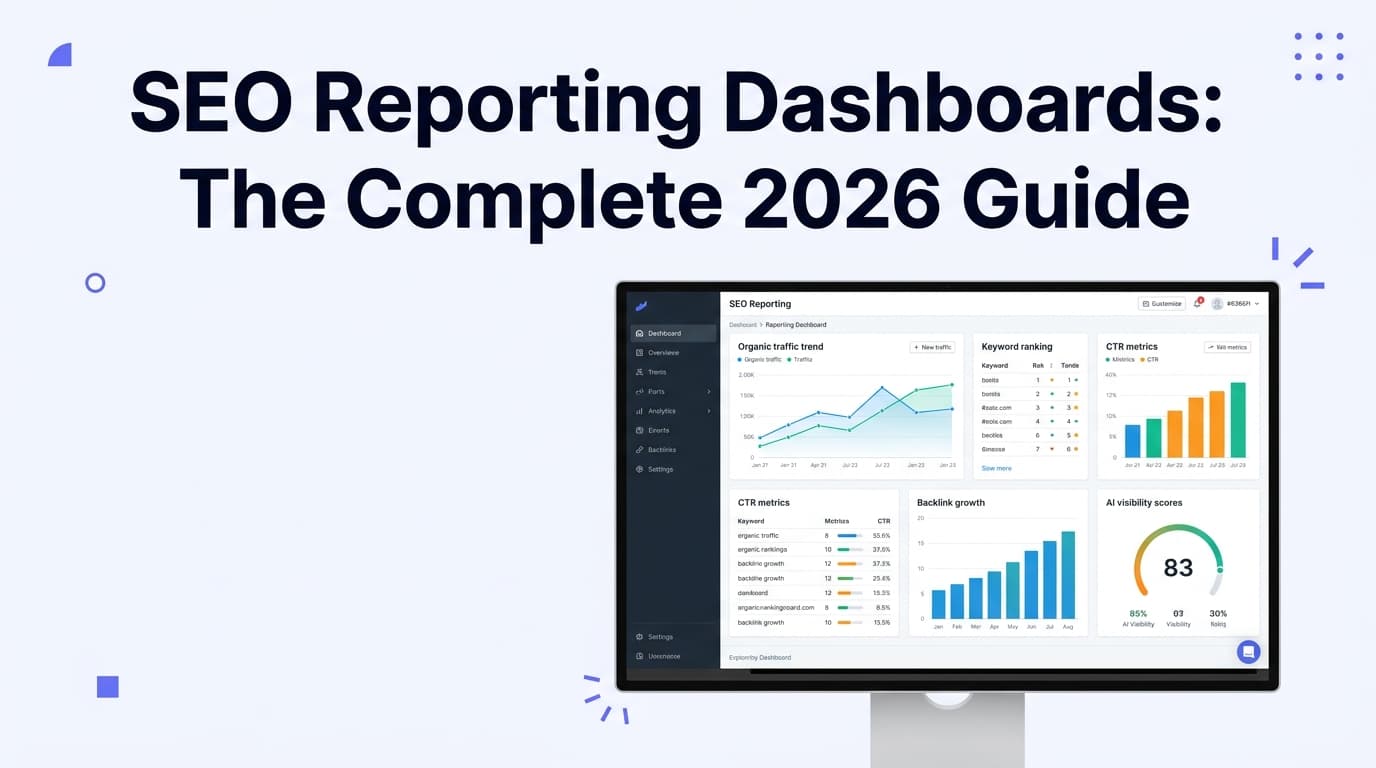
If you're still pulling SEO numbers from half a dozen tabs, copying them into a spreadsheet, and emailing a PDF — you're losing hours every week to a process that should take minutes. In 2026, SEO reporting has evolved into something far more powerful: a live, automated dashboard that not only tracks traditional rankings and organic traffic, but also monitors your brand's visibility inside ChatGPT, Gemini, Perplexity, and Google AI Overviews.
This guide covers everything you need to know about SEO reporting dashboards — what they are, which metrics to include, how to build one, and why the best-in-class dashboards in 2026 go far beyond keyword positions.
What Is an SEO Reporting Dashboard?
A search engine optimization (SEO) reporting dashboard is a visual summary of your organic search performance. It brings traffic, rankings, and conversions into one place so you can see what's working.
It's a reporting interface that pulls all your website performance data into one central location, tracking how your site performs across search engines by monitoring key metrics: organic traffic, keyword rankings, click-through rates, conversions, technical health, and more. Think of it as your SEO control room — instead of checking multiple tools separately and trying to connect the dots manually, you open one dashboard and get a clear picture of what is happening across your entire online presence.
The challenge is that SEO data makes sense to the people working in it daily, but not always to the clients paying for it. A dashboard bridges that gap by translating raw numbers into a clear picture of what's working, what isn't, and where results are coming from.
SEO Dashboard vs. SEO Report: What's the Difference?
An SEO report is a scheduled, narrative-driven deliverable; a dashboard is a real-time data view. Both serve important but distinct purposes:
SEO Dashboard — A live, always-on view of your key metrics. Used for ongoing monitoring, catching sudden changes, and giving stakeholders real-time access.
SEO Report — A structured, periodic document (weekly or monthly) that summarizes performance, provides context, and recommends next steps.
Most teams use both. The dashboard powers the report, and the report tells the story behind the dashboard's numbers.
Why SEO Dashboards Matter More Than Ever in 2026
In 2025, dashboards focused heavily on traditional organic traffic and keyword positions. In 2026, the landscape has shifted considerably. Your SEO dashboard now needs to go beyond traditional rankings — it needs to track your visibility across AI-generated search formats, monitor brand mentions in large language model outputs, and measure engagement quality rather than traffic volume alone.
According to HubSpot's 2026 marketing statistics, nearly 24% of marketers are actively updating their SEO strategies to address generative AI in search, and over 92% plan on or are already using SEO optimization for both traditional and AI-powered search engines.
Dashboards in 2026 track performance across the full search experience: classic blue links, AI Overviews, featured snippets, local packs, video results, and image carousels — and each placement type has its own value and requires its own tracking.
The reporting time cost is real. Between Google Analytics 4 sessions, Google Search Console queries, Semrush keyword movements, and Ahrefs backlinks, a single monthly SEO report can eat 25 to 30 percent of agency time — hours that could go to keyword research, technical fixes, and content optimization.
If you cut a 5-hour monthly SEO report down to 5 minutes across 10 clients, you save roughly 50 hours of agency time every single month. That is one full work week back.
The Essential Metrics for Your SEO Dashboard
Not every metric deserves a spot on your dashboard. Most SEO dashboards either show too much (every metric from every tool, no hierarchy) or too little (a handful of vanity numbers that don't connect to business outcomes).
Here's what a complete, well-structured dashboard should include in 2026:
Core Traffic & Visibility Metrics
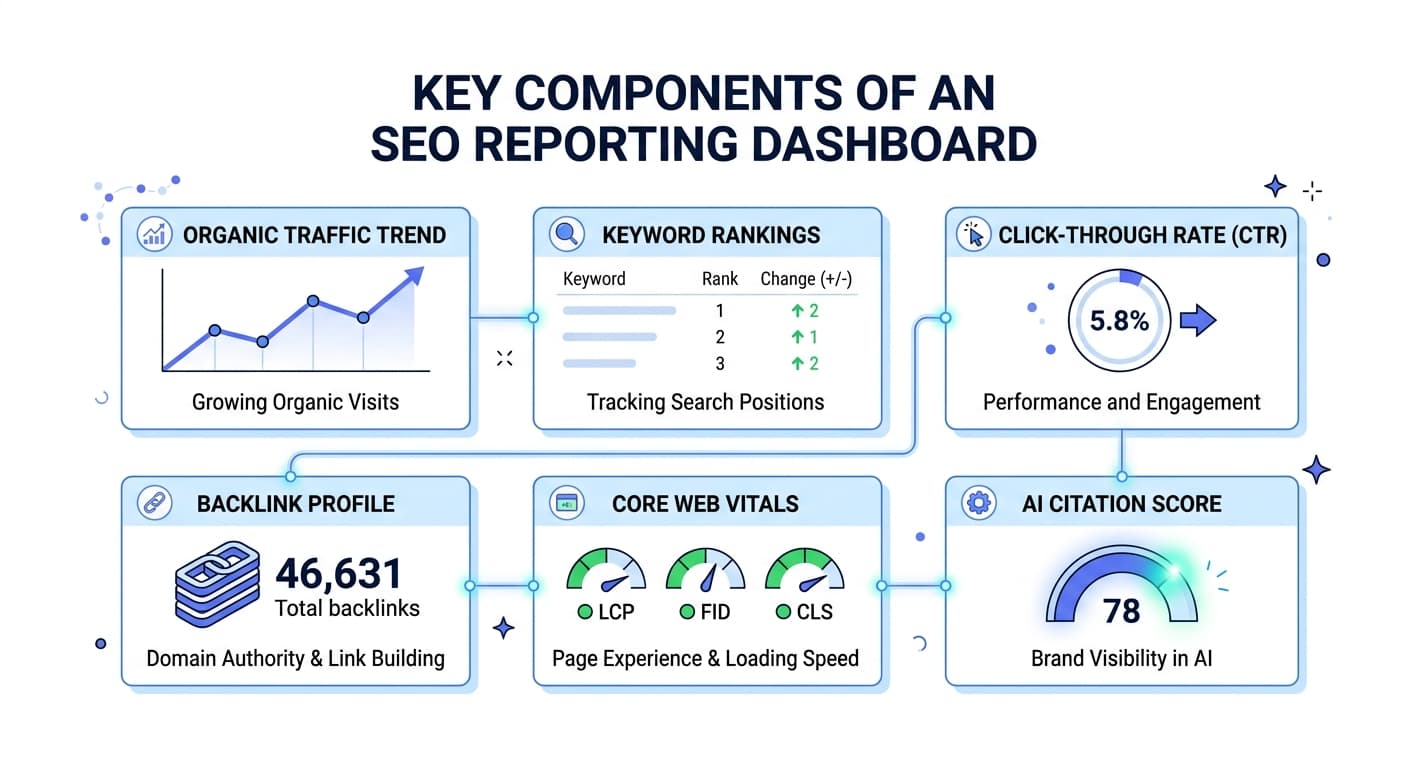
A complete SEO performance dashboard usually includes:
Core traffic metrics: organic traffic, search traffic, organic users, and year-over-year growth
Visibility metrics: keyword rankings, average keyword position in the SERPs, impressions, click-through rate (CTR)
Engagement metrics: average engagement time, pages per session, bounce rate
Conversion metrics: goal completions, leads, conversion rates, e-commerce revenue from organic search
Top content: best-performing landing pages and exit pages
Technical SEO health: indexed pages, technical issues, crawl errors, Core Web Vitals from a site audit
Off-page signals: referring domains, new backlinks, anchor text distribution from link building
Local SEO (if relevant): Google Business Profile views, calls, direction requests, and review scores
The Non-Negotiables
The non-negotiables are: organic sessions, impressions, clicks, average position, CTR, conversions from organic, and revenue from organic search. Beyond those, branded vs. non-branded query splits show whether growth is earned or just brand recovery. Keywords in top 3 and top 10 track ranking momentum. Page-level performance identifies which URLs are actually driving results.
Audience-Specific Views
Different stakeholders need different dashboard views. Before you create an SEO report, think about who will read it. A CEO, an SEO specialist, and a content manager all scan reports for different reasons — when they all get the same report, no one gets exactly what they need.
Here's how to break it down:
Executives: Executives care about business outcomes. Show how organic search traffic connects to leads, sales, or revenue. Focus on SEO metrics such as organic traffic trends, conversion data, and search engine visibility for priority target keywords. Skip technical details that don't tie back to financial impact.
SEO Managers: SEO specialists need data they can act on. Include keyword rankings, position tracking, keyword performance over time, and technical SEO issues like site speed or indexing problems.
Content Teams: Content teams think in terms of pages and topics. Show which pages gained organic traffic, how keyword performance shifted by page, and how user behavior changed. Pair keyword data with click-through rates so it's clear which content needs updates or expansion.
The 5 Core Data Sources to Connect
Effective SEO dashboards in 2026 connect at minimum five core data sources: Google Analytics 4, Google Search Console, third-party SEO tools, rank tracking platforms, and backlink analysis platforms.
The same source notes that 92% of marketers now rely on such integrated dashboards to monitor organic traffic, keyword rankings, backlink profiles, and technical health.
Here's what each source contributes:
Google Search Console: Best for clicks, impressions, CTR, query visibility, and URL-level search performance - GA4: Best for sessions, engagement, conversions, landing page outcomes, and downstream business behavior - Rank tracking platform: Best for daily keyword movement, share of visibility, and monitored term volatility - Backlink analysis tool: Best for link acquisition trends, authority shifts, and off-page risk
You can run a quick technical SEO audit to make sure your site is sending clean, accurate data to all of these sources before connecting them to your dashboard.
How to Build an SEO Reporting Dashboard in 2026
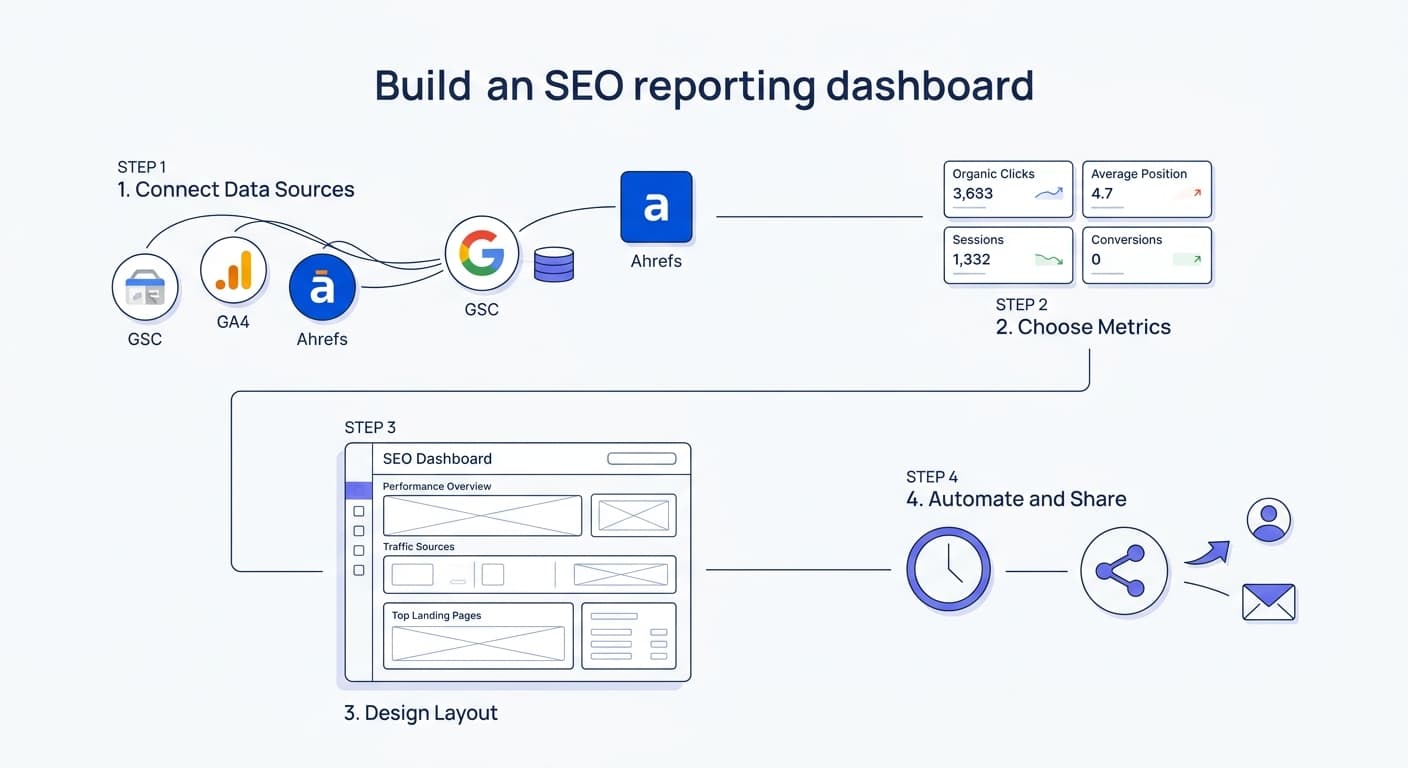
Building an SEO dashboard doesn't require technical expertise or a large budget. Here's a practical step-by-step process:
Step 1: Define Your Audience and Goal
Before picking a tool or a metric, answer: who reads this dashboard and what decision should it help them make? The biggest mindset shift is this: don't build a dashboard to "show performance." Build it to support a decision. That usually means each view should answer one job clearly.
Step 2: Request Access to Your Data Sources
Ask your client to open Google Search Console, navigate to Settings, and click "Users and permissions" — from there, they can add your email and assign you full permissions. Google Analytics (GA) access is also worth requesting at the same time.
Step 3: Choose Your Dashboard Tool
Using Google Looker Studio, a free data visualization platform, you can build from scratch any marketing dashboard, and take advantage of the available free and paid SEO template resources.
For agencies and teams that need more polish and automation, paid tools like AgencyAnalytics, DashThis, Whatagraph, and Databox offer significant time savings with pre-built SEO templates.
Step 4: Connect Your Data and Choose Metrics
Keep it focused. Keep each report tight — three to five key metrics usually do the job. This makes the report easier to scan and keeps attention on SEO performance that affects results. Start with keyword rankings, organic traffic, and conversion metrics.
Step 5: Automate Updates and Alerts
An SEO dashboard that provides real-time automated updates is essential for timely decision-making. SEO landscapes change rapidly, and having up-to-date data allows users to quickly adapt their strategies to algorithm changes, competitor moves, or shifts in user behavior.
The goal is automated detection, routing, and task creation. When a ranking drop, technical regression, or AI visibility loss appears, the dashboard should trigger the next step without waiting for someone to compile evidence first.
Step 6: Share and Iterate
Share via a live link rather than a PDF export — clients open it any time and always see current data, which cuts down the "can you send me an update?" requests between reporting cycles.
The New Dimension: AI Visibility in SEO Dashboards
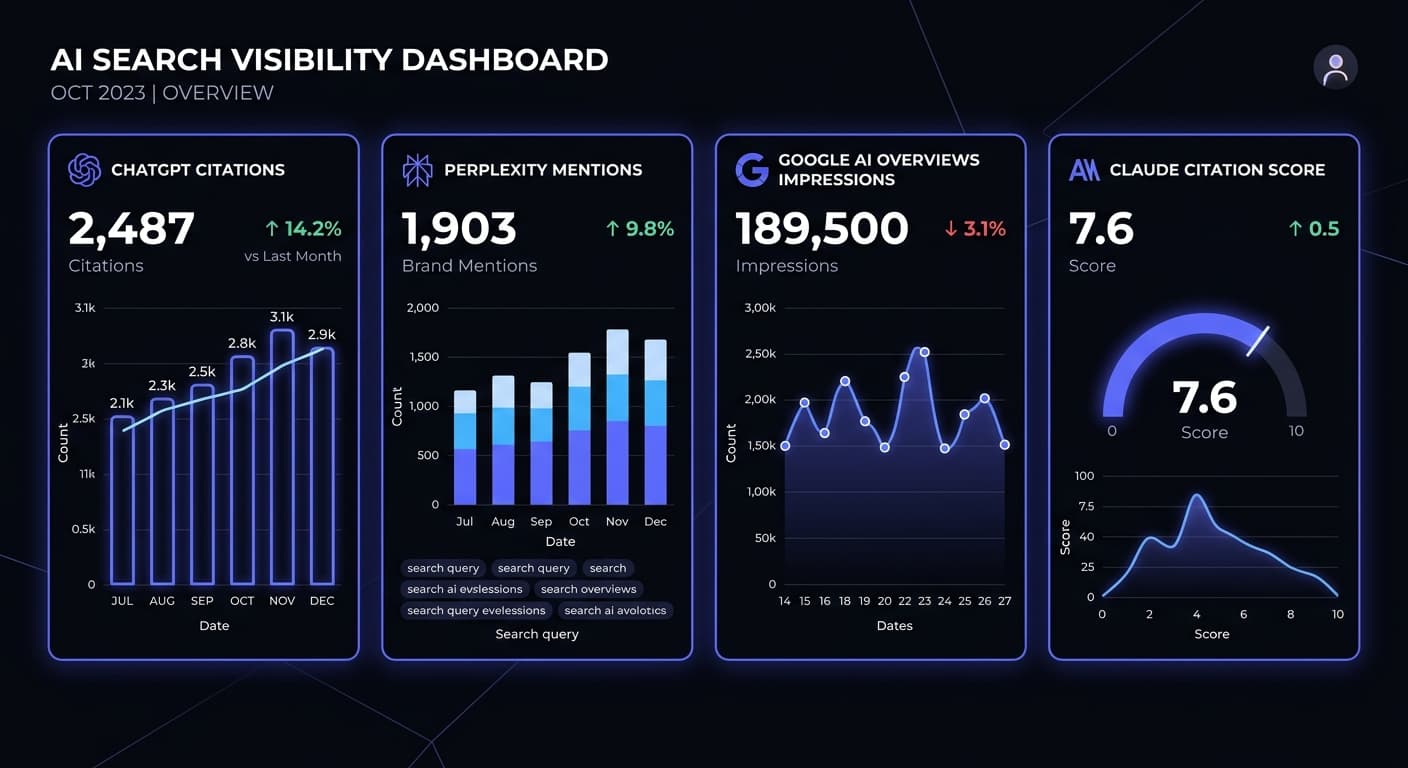
This is the biggest shift in SEO reporting in 2026 — and most dashboards haven't caught up yet.
A Goodfirms 2026 survey found only 14% of marketers currently use AI citation tracking, despite 43% naming AI search optimization as a core 2026 strategy. This represents the largest measurement gap in the current SEO landscape.
AI search visibility refers to how often and how prominently your brand or content appears in AI-generated responses, such as those from ChatGPT, Google AI Overviews, or Perplexity. It matters in 2026 because a significant portion of user queries are now answered directly by AI models, leading to "zero-click" interactions. If your brand isn't visible in these AI responses, it becomes invisible to a growing segment of the audience, impacting brand awareness, lead generation, and ultimately, revenue.
New AI Metrics to Add to Your SEO Dashboard
Your KPI dashboard for 2026 must expand beyond traditional metrics. Here are the new performance indicators you should track alongside conventional SEO metrics:
AI Citation Frequency: How often your brand/content appears in AI-generated answers across platforms
Share of Voice in AI: Your brand's citation rate vs. competitors in target topic areas
Brand Mention Sentiment: Are AI tools presenting your brand positively when cited?
Zero-Click Impression Value: Estimated brand awareness generated from AI citations without direct clicks
AI-Driven Referral Traffic: Track UTM-tagged traffic from AI platforms like Perplexity that do send clicks
Knowledge Panel Presence: Is your brand entity recognized in Google's Knowledge Graph?
The Business Case for Integrated Tracking
There's a clear performance gap between integrated and siloed search strategies. Among organizations that fully integrate SEO and AI visibility into a unified workflow, 81% reported increased traffic or leads from AI platforms. Among organizations managing the two areas separately, only 36% reported the same result. The finding suggests that AI visibility is most effective when connected to existing SEO, content, communications, and brand programs rather than treated as a standalone initiative.
Top SEO Reporting Dashboard Tools in 2026
Here's a quick breakdown of the leading tools, organized by use case:
For Agencies: White-Label Client Reporting
AgencyAnalytics — Built specifically for marketing agencies that need white-labeled client reports. Its standout feature for SEO agencies is built-in rank tracking and site audits.
DashThis — With a wide range of pre-built widgets and templates, DashThis simplifies the process of creating visually compelling reports that showcase key SEO metrics. You can customize the reports with your branding, add annotations or notes, and easily share them with clients or team members. DashThis offers automated data updates, scheduled email reports, and multi-channel reporting.
For Flexibility: Free & Custom Dashboards
Looker Studio (Google Data Studio) — A reporting and dashboard tool that lets you connect multiple data sources. It's widely used for SEO reporting because it's flexible enough to combine GA4, Google Search Console, rank tracking exports, and custom spreadsheets into one "source of truth."
Databox — Each metric lives in a "datablock" that updates automatically. Resize, reorder, and apply filters without writing code. Automation shines here — you can schedule snapshot emails, Slack alerts, or share a live link with stakeholders.
For AI Visibility: Dedicated Platforms
Semrush AI Visibility Toolkit — Tracks over 100 million prompts across ChatGPT, Google AI Mode, Perplexity, and AI Overviews in six regions.
Profound — The category's commercial leader and G2 Winter 2026 AEO Leader. On its Enterprise tier it captures data from up to nine answer engines — ChatGPT, Claude, Perplexity, Google AI Overviews, Gemini, Copilot, DeepSeek, Grok and Google AI Mode.
SEO Dashboard Best Practices for 2026
1. Build for Action, Not Just Visibility
A passive dashboard shows that clicks dropped. An actionable dashboard tells you whether the drop came from lower impressions, weaker CTR, indexation loss, content decay, device-specific UX issues, or a SERP change that needs a different response.
2. Match Cadence to the Audience
Daily monitoring, weekly diagnostics, and monthly narrative reporting should not live in the same visual layer. Structure your dashboard accordingly — daily alerts for technical regressions, weekly views for ranking movement, monthly summaries for executive reporting.
3. Link Metrics to Business Outcomes
To create SEO reports for clients in 2026, focus on business impact first — connect SEO performance directly to traffic, leads, and revenue, not just rankings or sessions. The most effective SEO client reporting highlights a small set of goal-driven KPIs, presented visually with short explanations and clear month-over-month comparisons.
4. Always Add Context to the Numbers
Metrics without context create confusion. Numbers go up or down, but clients want to know why. Add brief context for every major shift. Note algorithm updates, content changes, technical fixes, or seasonal factors that explain the data.
5. Track Competitor Visibility
Tracking competitor keyword movements and backlink growth helps you stay informed about market shifts and identify gaps in your own strategy.
6. Review at the Right Frequency
Check your dashboard weekly to catch sudden changes in traffic or rankings. Review it monthly to assess overall trends and quarterly to evaluate strategic performance.
Common SEO Dashboard Mistakes to Avoid
Metric overload — Most businesses struggle with choosing which metrics to prioritize. Tracking too many numbers makes it hard to act on any of them. Start with five to seven core metrics and expand from there.
Static PDFs instead of live links — Unlike static examples of SEO reports, live dashboards update automatically when connected to your data sources via native, stable integrations.
Missing the AI blind spot — A phone call from a Local Pack listing, a trust effect from a knowledge panel appearance, a recommendation inside ChatGPT — all of it carries real commercial value, and none of it shows up on a standard dashboard. The ROI looks weaker than it is, and when ROI looks weak, budgets get cut.
No ownership on action items — Every important change needs a named next action, not just commentary. Your dashboard should make it obvious who owns the next move.
How to Scale SEO Reporting Across Multiple Clients
For agencies managing multiple accounts, manual reporting is a growth killer. According to Swydo's 2026 automation research, agencies spend 3 to 6 hours per client weekly on manual reporting — with 15 clients, that is up to 90 hours weekly. Automation using a dedicated SEO reporting software reduces this to 15 to 30 minutes per client for adding strategic commentary. Most agencies see positive ROI on the reporting tool investment within 30 to 60 days.
The winning formula for scalable agency reporting:
Templatize — Build one core dashboard template per client type (ecommerce, local, SaaS, etc.)
Automate — Use scheduled data refreshes so dashboards are always current without manual pulls
White-label — A white label SEO dashboard allows you to inject brand elements of your agency such as logos, color schemes, and fonts into the dashboard. White labeling is especially important for SEO agencies as it helps maintain brand consistency and professionalism while building trust with existing or potential clients.
Add AI visibility — Include a layer for AI citation tracking, especially for clients asking about their presence in ChatGPT and Perplexity
You can also explore ready-made SEO report templates to fast-track your setup and deliver client reports that look polished from day one.
The 2026 SEO Dashboard Checklist
Use this checklist to evaluate whether your current dashboard is fit for purpose:
Connected to GA4, Google Search Console, and a rank tracker
Shows organic traffic, keyword rankings, CTR, and conversions
Includes branded vs. non-branded query split
Tracks top-performing pages and landing pages
Monitors technical SEO health (crawl errors, Core Web Vitals)
Includes backlink growth and referring domains
Tracks AI visibility — citations in ChatGPT, Gemini, Perplexity, and AI Overviews
Has audience-specific views (exec summary, SEO deep-dive, content performance)
Automated updates — no manual data pulls
Live shareable link for clients, not a static PDF export
Every metric section has context notes and named next actions
Conclusion
The SEO reporting dashboard has come a long way from a weekly ranking export pasted into a Google Doc. In 2026, the best dashboards are live, automated, multi-source, and — critically — built to track performance across both traditional Google search and the AI chatbots that are reshaping how people find information.
In 2026, the best dashboards go beyond keyword rankings and organic traffic. They track technical health, content engagement, backlink growth, local visibility, and the growing influence of AI-generated search results. The businesses that will grow their online presence this year are those that monitor all of these signals and act on what the data tells them.
The shift is clear: visibility is now multi-surface, and your dashboard needs to match. Whether you're an in-house SEO, a growing agency, or a founder trying to prove ROI from content, a well-built SEO reporting dashboard is the foundation everything else is built on.
QuickSEO is a free Google Search Console dashboard for all your websites. Connect Search Console, pick the properties you want, and see clicks, impressions, CTR and average position for every site on one screen, each compared with the previous period, with the keywords and pages behind the numbers. Connect Search Console for free →
QuickSEO shows clicks, impressions, keywords and pages for every website you manage, compared with the period before.
- Unlimited websites on the free plan
- No credit card needed
Keep reading
Related posts
More articles on the same topics, prioritized by shared tags and keyword overlap.