Summarize in ChatGPT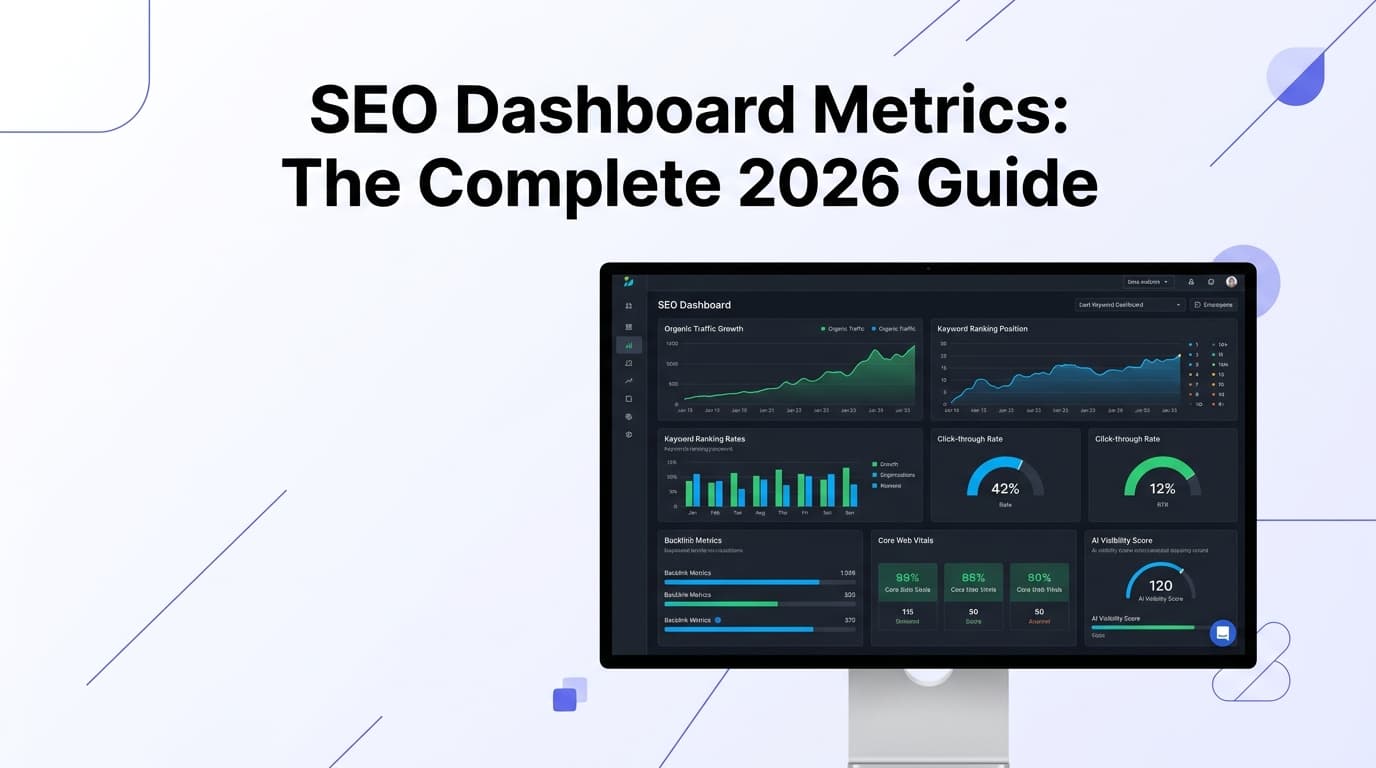
If you've ever stared at a screen full of charts and wondered which numbers actually matter, you're not alone. Most SEO dashboards track 20+ metrics, but only a handful of them truly matter — including traffic, rankings, backlinks, CTR, competitor visibility, technical health, and the increasingly critical category of AI visibility.
The stakes are higher than ever. SEO success is no longer measured by rankings alone. In 2026, a strong SEO measurement system tracks visibility, traffic quality, user engagement, technical performance, conversions, revenue, and AI search visibility.
This guide breaks down every metric your SEO dashboard should include — and, just as importantly, the ones you can safely deprioritize. Whether you're an in-house marketer, a freelancer, or an agency, this is your complete reference for building a dashboard that drives real decisions.
Why Your SEO Dashboard Needs a Rethink in 2026
SEO reporting in 2026 is no longer about sending a monthly report filled with rankings and traffic screenshots. The teams making better decisions now use SEO reporting to connect visibility, technical health, content quality, and conversion performance in one clear system.
The problem? Vanity metrics are everywhere. Rankings can rise while leads stay flat. Traffic can grow while pipeline quality drops. A dashboard can look busy while the site still has crawlability, indexing, JavaScript, or Core Web Vitals issues holding back real growth.
Three to five well-chosen KPIs produce clearer, more actionable reports than twenty loosely related metrics spread across a dense report. An SEO metrics dashboard organizes those KPIs into a centralized, automatically updated view connected directly to live data sources — serving your team for ongoing monitoring and anomaly detection, while keeping clients connected between formal reporting cycles.
The key is understanding which metrics are leading indicators (showing you where you're heading) and which are lagging indicators (confirming where you've been). Most SEO KPIs like keyword rankings, impressions, and organic traffic are leading indicators that show progress and usually signal whether you're moving in the right direction. Over time, stronger leading indicators tend to produce better lagging indicators — such as leads, phone calls, and revenue.
The Core SEO Dashboard Metrics to Track
1. Organic Traffic
This is the foundation of every SEO dashboard. Tracking organic sessions over time is one of the strongest indicators of SEO performance. Seasonal fluctuations aside, a month-over-month increase in visitors from organic search shows that rankings are improving — even for keywords you weren't targeting.
Benchmark: A healthy site in a stable industry grows organic traffic 10 to 25 percent year over year. New sites can grow faster — 50 to 200 percent — once they pass the initial sandbox period of three to six months.
Where to find it: Google Analytics 4 (GA4) > Acquisition > Traffic Acquisition > Organic Search
2. Keyword Rankings & Share of Voice
A single keyword position is a snapshot, not a story. Pair your average position tracking with share of voice — your visibility across a basket of target keywords versus competitors. It smooths out single-keyword noise.
Share of voice measures your visibility relative to competitors in your industry or niche — a critical competitive intelligence metric. This competitive context transforms absolute metrics into relative performance indicators, showing whether you're gaining or losing ground in your market regardless of overall search volume trends. Share of voice is particularly valuable for stakeholder reporting because it demonstrates market position rather than isolated performance.
Benchmark: Aim for 15% to 25% share of voice within your core topic cluster to be considered a category leader.
3. Click-Through Rate (CTR)
Getting a top ranking means nothing if users don't click. CTR tells you whether your title tags and meta descriptions are compelling enough to win the click.
60% of searches are zero-click, but impressions still measure visibility even without clicks. A blog post with 50,000 impressions and 500 clicks (1% CTR) isn't "failing" — it delivered 49,500 brand impressions.
You can use QuickSEO's SERP Preview tool to visualize exactly how your title tags and meta descriptions appear in Google before you publish — and use the AI Title Tag Generator to craft click-worthy titles at scale.
Benchmark: Featured snippets achieve 67% CTR versus 28% for standard position #1. For non-featured pages, the median organic CTR sits at around 12%, with top-quartile pages hitting 23%+.
4. Organic Conversion Rate
Traffic without conversion is just noise. The organic conversion rate is the percentage of visitors who arrive at your website via search engines and perform a desired action — such as making a purchase, signing up for a newsletter, or filling out a contact form. It is among the most important metrics used to determine how well your SEO efforts have translated into valuable actions.
Formula: To find your organic conversion rate, take the number of organic conversions and divide it by the total number of organic visitors, then multiply by 100 to express it as a percentage.
Where to find it: GA4 > Conversions, segmented by Organic channel.
5. Branded vs. Non-Branded Traffic
Split your organic traffic by queries that contain your brand name versus those that don't. Non-branded traffic is the cleaner measure of SEO's incremental value — branded traffic usually reflects brand-marketing spend, not SEO effort.
Benchmark: For a healthy SaaS, non-branded traffic should be 50% to 70% of total organic. A sudden jump in branded without a paid campaign often signals PR or virality.
Technical Health Metrics: The Ones Most Dashboards Miss
6. Core Web Vitals (LCP, INP, CLS)
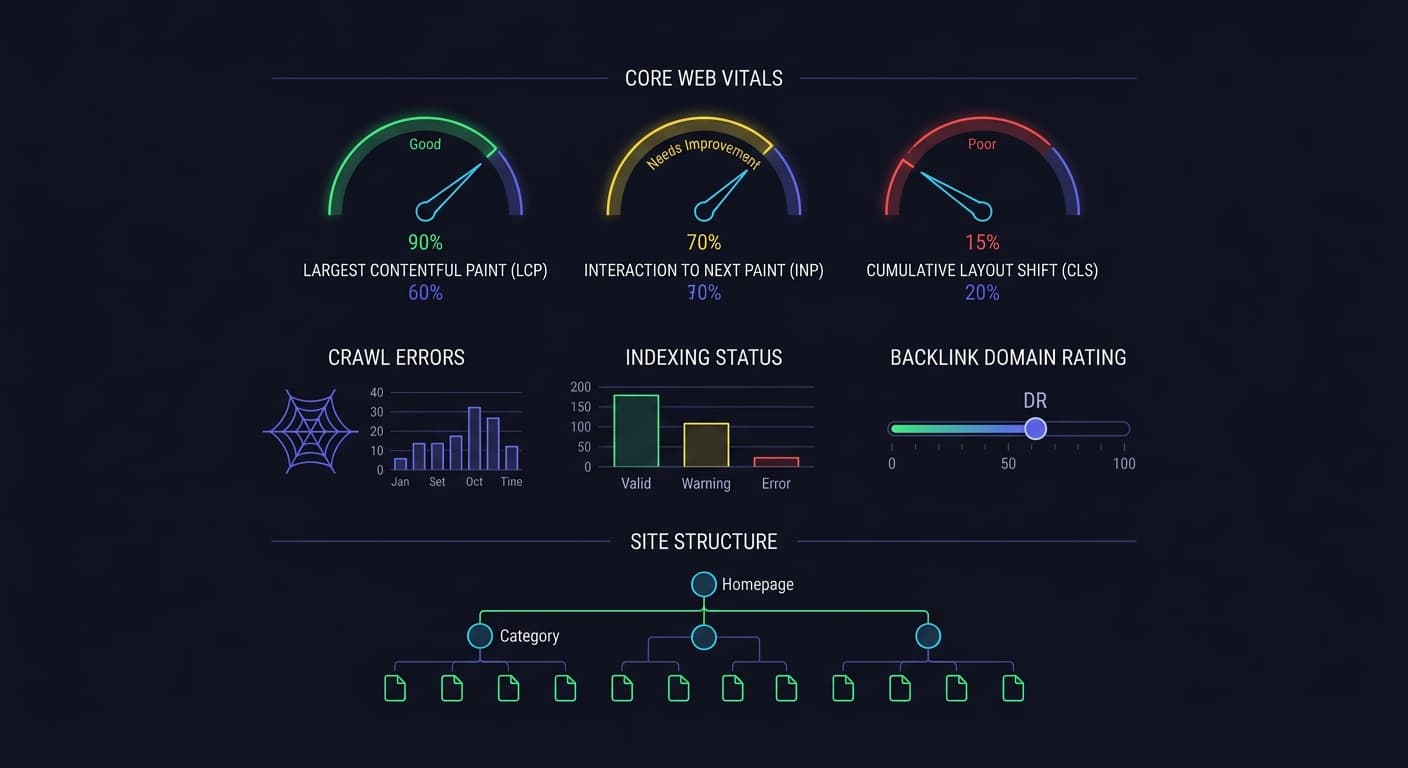
Google uses mobile-first indexing, meaning mobile performance determines desktop rankings. Prioritize LCP < 2.5s, INP < 200ms, and CLS < 0.1.
35% of mobile sites fail Core Web Vitals — and 53% of users abandon pages that take over 3 seconds to load. These aren't just technical metrics; they directly impact traffic and revenue.
7. Indexed Pages & Crawl Health
If Google can't crawl and index your pages, none of your other metrics matter. Your dashboard should track:
Total indexed pages (via Google Search Console > Index Coverage)
Crawl errors (4xx, 5xx status codes)
Noindex tags applied accidentally (use QuickSEO's Noindex Checker to find these fast)
XML Sitemap health — validate it with the Sitemap Validator
Fix crawl errors immediately by checking the Google Search Console Coverage report weekly.
QuickSEO runs a technical SEO audit of every website you add, re-runs it every week, and ranks every issue by severity.
8. Backlinks & Referring Domains
Despite evolving algorithms, 58.1% of businesses consider link building a key factor in improving SERP rankings, and around 85% of marketing experts believe that link building will still be an important ranking factor in 5 years.
Your dashboard should track:
Referring domains (not just raw backlink count)
Domain Rating / Domain Authority growth over time
New vs. lost backlinks month-over-month
Link quality — editorial placements vs. footer links
9. SERP Feature Visibility
In 2026, SEO is also about AI Overviews, voice search, and Google's Search Generative Experience. That means your KPIs need to evolve too. It's not just about ranking on page one anymore — it's about showing up in featured snippets, AI-generated answers, and "People Also Ask" boxes.
Track how many of your target keywords trigger SERP features and whether your content is appearing in them.
The New Frontier: AI Visibility Metrics
This is the category that most SEO dashboards are still missing — and it's arguably the most important evolution in search measurement since GA4.
A brand can have excellent technical SEO, strong domain authority, and top-three rankings across its core keywords while simultaneously being invisible in AI-generated responses. The inverse is also true: a brand with modest traditional search performance might be consistently cited by AI models because its content is structured in ways that AI retrieval systems favor. Neither scenario shows up in a standard SEO dashboard.
AI Overviews now reduce organic clicks by approximately 58% on queries where they appear (Ahrefs, February 2026). If your measurement framework doesn't account for it, that's a blind spot.
Here are the key AI visibility metrics to add to your dashboard:
AI Citation Rate
This measures how often your URL is cited as a source in Google's AI Overviews, Perplexity, ChatGPT, and other answer engines. It's effectively the 2026 replacement for tracking "featured snippets earned."
Benchmark: For a domain with 500+ ranking keywords, being cited in 10% to 20% of AI Overviews on your target terms is considered strong.
AI Share of Voice
Measure how often your brand appears in AI responses relative to competitors for your core topics. Higher share of voice indicates stronger topical authority — and gives you a competitive benchmark that raw citation counts alone can't provide.
In generative search, competitors may outrank you in AI visibility even if your organic rankings are strong. That is why AI metrics like Citation Rate and Share of Voice are critical for competitive tracking.
Benchmark: B2B SaaS companies average 8–12% AI Share of Voice. Top-quartile companies reach 18–24%.
Sentiment & Brand Framing
It's not enough to simply appear in AI answers. You need to track how your brand is presented — whether it's described positively, negatively, or neutrally. This is a layer of insight that traditional SEO metrics simply can't provide.
How to Set Up Your SEO Dashboard: Best Practices
Most businesses struggle with choosing which metrics to prioritize. Tracking too many numbers makes it hard to act on any of them. Start with five to seven core metrics and expand from there.
Here's the approach we recommend:
Define your business goal first. The most important metric depends on the business goal — for lead generation, organic conversions matter most; for ecommerce, revenue from organic; for brand growth, non-branded traffic.
Set benchmarks from your own historical data. Historical data from Google Analytics and Google Search Console shows how your site has actually performed over time, across algorithm updates, seasonality, site changes, and campaigns. Look at organic traffic, keyword rankings, conversions, and organic click-through rate over the last 6 to 12 months — this gives you a realistic picture of momentum, not a fantasy based on averages.
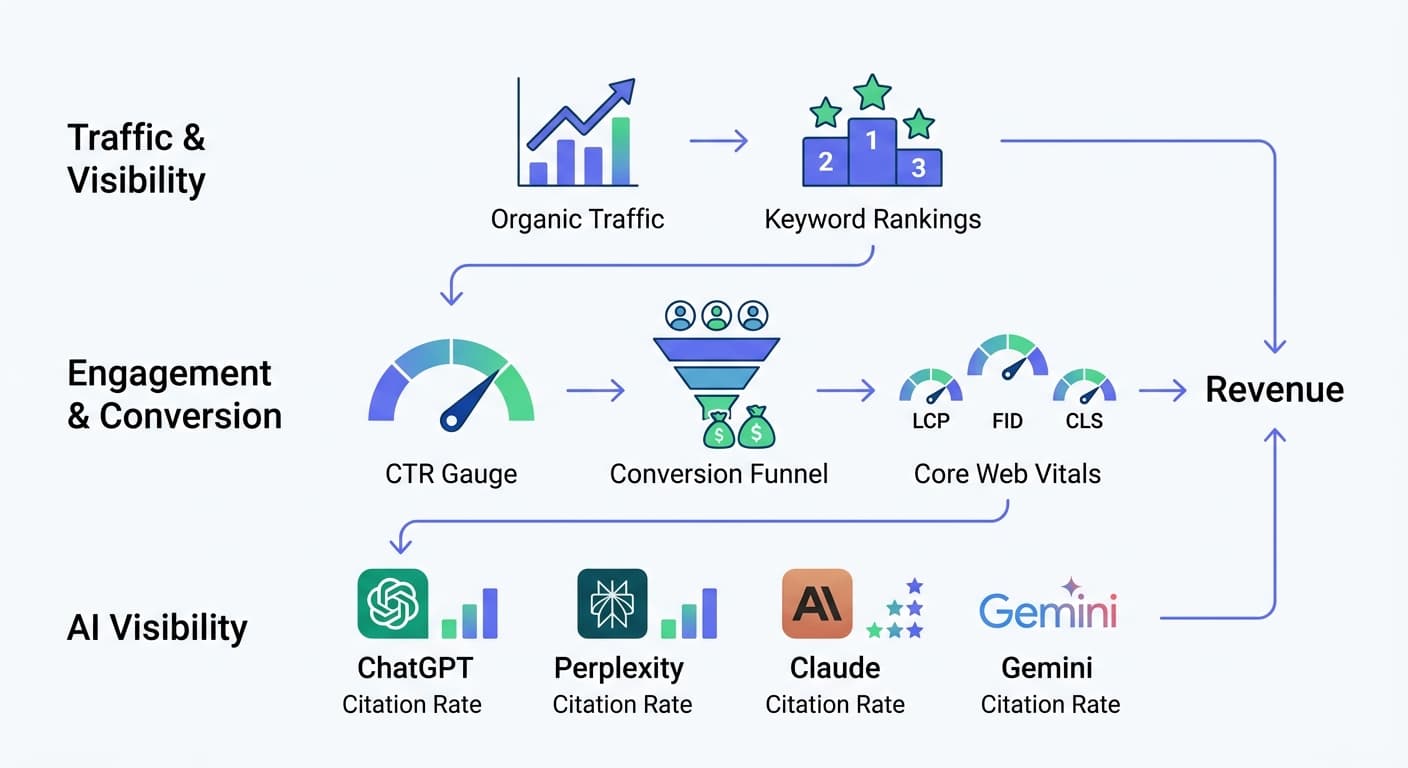
Layer your metrics. Connect leading indicators (rankings, impressions, AI citations) to lagging indicators (conversions, revenue) so every number tells part of a bigger story.
Review on the right cadence. Most SEO metrics should be reviewed monthly, with rankings and Core Web Vitals checked weekly. Daily tracking is rarely useful because organic data fluctuates with search demand, and trend lines are clearer over 30-day windows.
Include content quality signals. Following a series of Google core updates through 2025, dashboards now increasingly surface content quality metrics: page depth (how far users scroll), time on page, return visit rates, and internal link engagement. These signals help identify which content is genuinely serving users versus which pages are simply filling keyword gaps.
Recommended Tools for Each Metric
Metric | Best Free Tool | Best Paid Tool |
|---|---|---|
Organic Traffic | Google Analytics 4 | Semrush |
Keyword Rankings | Google Search Console | Ahrefs |
Core Web Vitals | Google PageSpeed Insights | Datadog |
Backlinks | Google Search Console | Ahrefs / Moz |
AI Visibility | Bing AI Dashboard | — |
Share of Voice | Search Console (partial) | — |
The SEO metrics you need to track live in six different tools by default: GA4, Google Search Console, Ahrefs, PageSpeed Insights, a CRM, and an AI visibility tracker. Most marketers spend two hours building each monthly report by copying and pasting into a spreadsheet. A unified SEO reporting tool pulls every metric into one place, refreshes automatically, and turns the monthly two-hour ritual into a five-minute review.
Metrics You Can Safely Deprioritize
Not every number deserves a spot on your dashboard. Here are a few common vanity metrics to drop:
Raw bounce rate — GA4 replaced this with "engagement rate," which is more meaningful anyway
Total backlink count — referring domains is a far better quality signal
Pages per session — bounce rate, pages per session, and time on site are deliberately excluded from modern frameworks because knowing how people behave once they arrive is not the same as knowing whether SEO is working
Keyword density — no longer a meaningful ranking signal on its own
Alexa Rank / toolbar PageRank — both deprecated
Conclusion: Build a Dashboard That Drives Action
The biggest mistake is reporting on only one metric in isolation. A great SEO dashboard tells a complete story — connecting your organic visibility to engagement, technical health, conversions, and, increasingly, your presence inside AI-generated answers.
Organic search remains the largest trackable traffic channel, accounting for 53.3% of channel share. Yet Ahrefs found that 96.55% of pages receive no organic traffic from Google — which shows why measurement must go beyond publishing content and hoping it works.
The SEO teams winning in 2026 aren't the ones with the most metrics — they're the ones with the right metrics, reviewed at the right frequency, with clear actions tied to each one. That includes the new layer of AI visibility data that traditional dashboards simply don't capture.
QuickSEO is a free Google Search Console dashboard for all your websites. Connect Search Console, pick the properties you want, and see clicks, impressions, CTR and average position for every site on one screen, each compared with the previous period, with the keywords and pages behind the numbers. Connect Search Console for free →
QuickSEO shows clicks, impressions, keywords and pages for every website you manage, compared with the period before.
- Unlimited websites on the free plan
- No credit card needed
Keep reading
Related posts
More articles on the same topics, prioritized by shared tags and keyword overlap.