GSC Data Interpretation: The Complete 2026 Guide to Turning Search Console Numbers Into SEO Wins

 Summarize in ChatGPT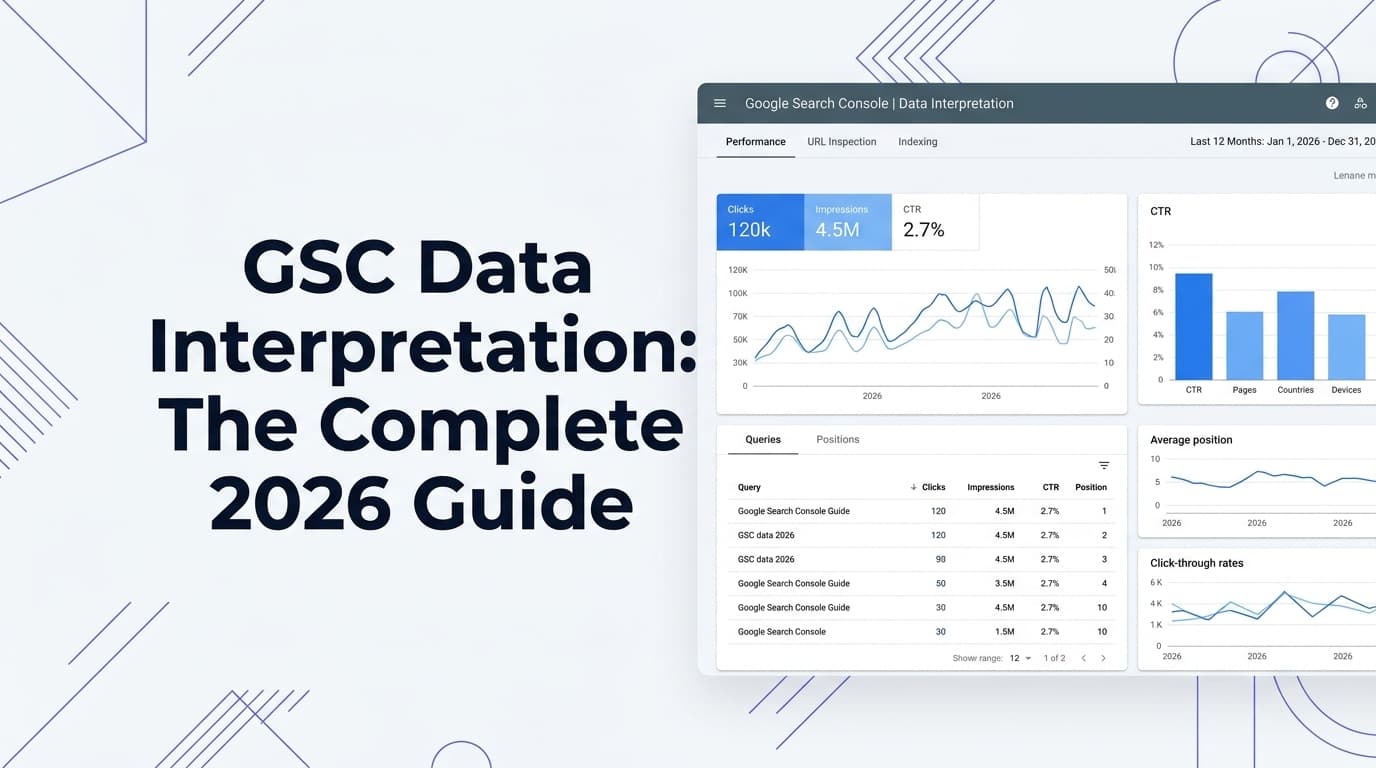
Google Search Console (GSC) is sitting on your browser tab right now — and there's a good chance you're only using about 20% of what it can tell you.
Most marketers open GSC, glance at the clicks trend line, and close it again. That's an expensive habit. GSC is the only tool that gives you direct data straight from Google itself: which queries trigger your pages in search results, how many impressions and clicks each page receives, which pages are indexed, what crawl errors Googlebot encounters, and whether your site has any manual actions or security issues. Unlike third-party SEO tools that estimate and approximate, GSC provides ground truth data.
In 2026, that ground truth has become even more valuable — and more complex to read. The Performance report has become even more valuable in 2026 as it now includes data from AI Overviews and AI Mode alongside traditional search results. That means the same numbers you've always tracked now carry new meaning.
This guide walks through every layer of GSC data interpretation — from the four core metrics to indexing status codes to the AI-era signals that require a fresh lens.
The Four Core GSC Metrics (And What They Actually Mean)
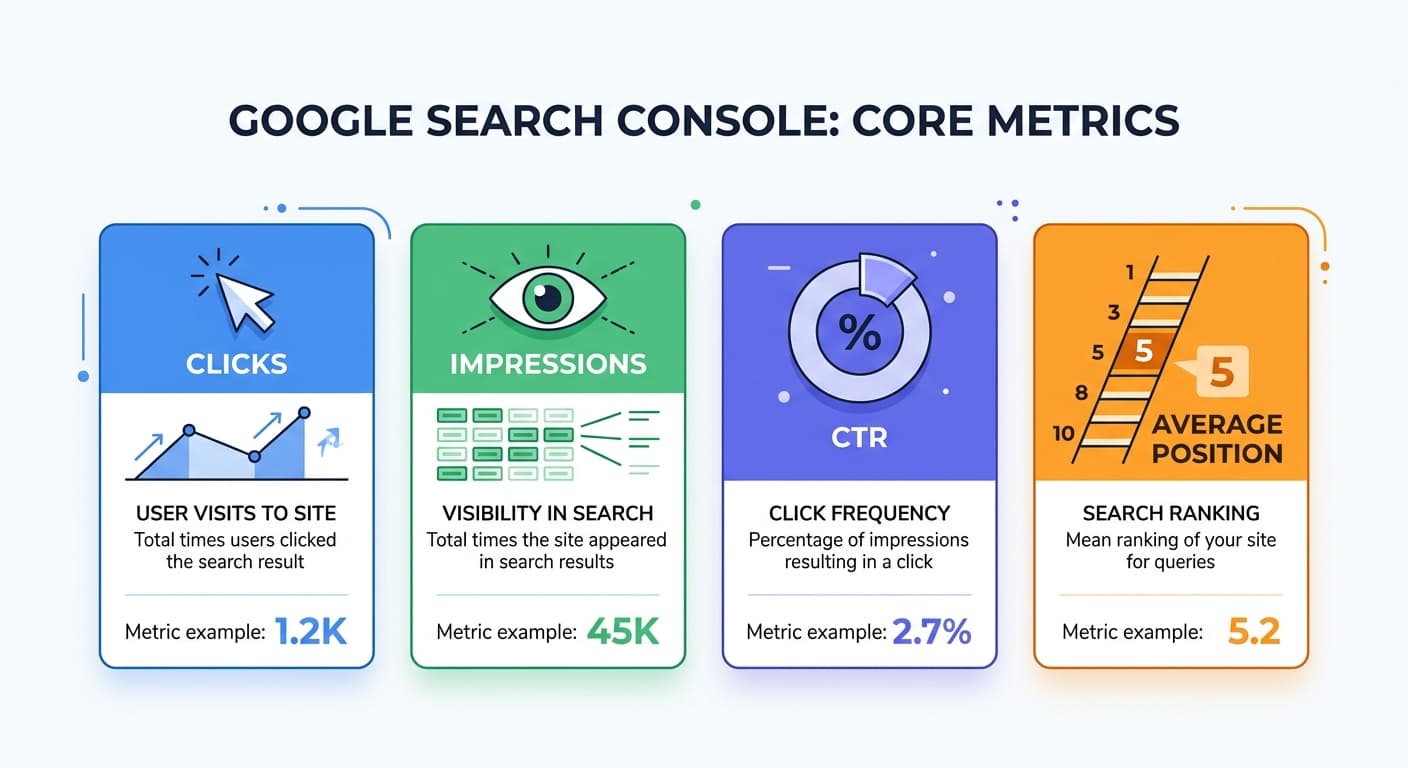
The Performance report in Search Console reveals what is happening in Google Search results: it aggregates clicks, impressions, click-through rate (CTR), and average position, all broken down by query, page, country, device, and search appearance. Here's what each metric actually communicates:
Clicks
Clicks are the number of times users clicked on your search result. They represent actual traffic arriving at your site from Google organic search. Track clicks by page to understand which content drives the most engagement, and by query to understand which topics attract your audience.
But clicks alone don't tell the full story. Clicks are a measure of traffic acquisition, but they are no longer the complete story. AI summaries often provide answers to queries made by the user without the need to make a click, particularly for informational purposes.
Impressions
Impressions are the number of times your URL appeared in search results, regardless of whether it was clicked. High impressions with low clicks indicate an opportunity to improve titles, meta descriptions, or page positioning.
As more searches result in an answer without a click, performance cannot be reduced to traffic generation alone: visibility (impressions) takes on strategic importance, particularly for measuring your presence on high-volume queries.
CTR (Click-Through Rate)
Click-through rate is the calculation of clicks ÷ impressions. It tells you how compelling your listing looks to searchers — and it's one of the most actionable metrics in GSC.
CTR tells you how compelling your result is compared to others on the SERP. A high CTR means your title tag and meta description (or rich snippet) are working well.
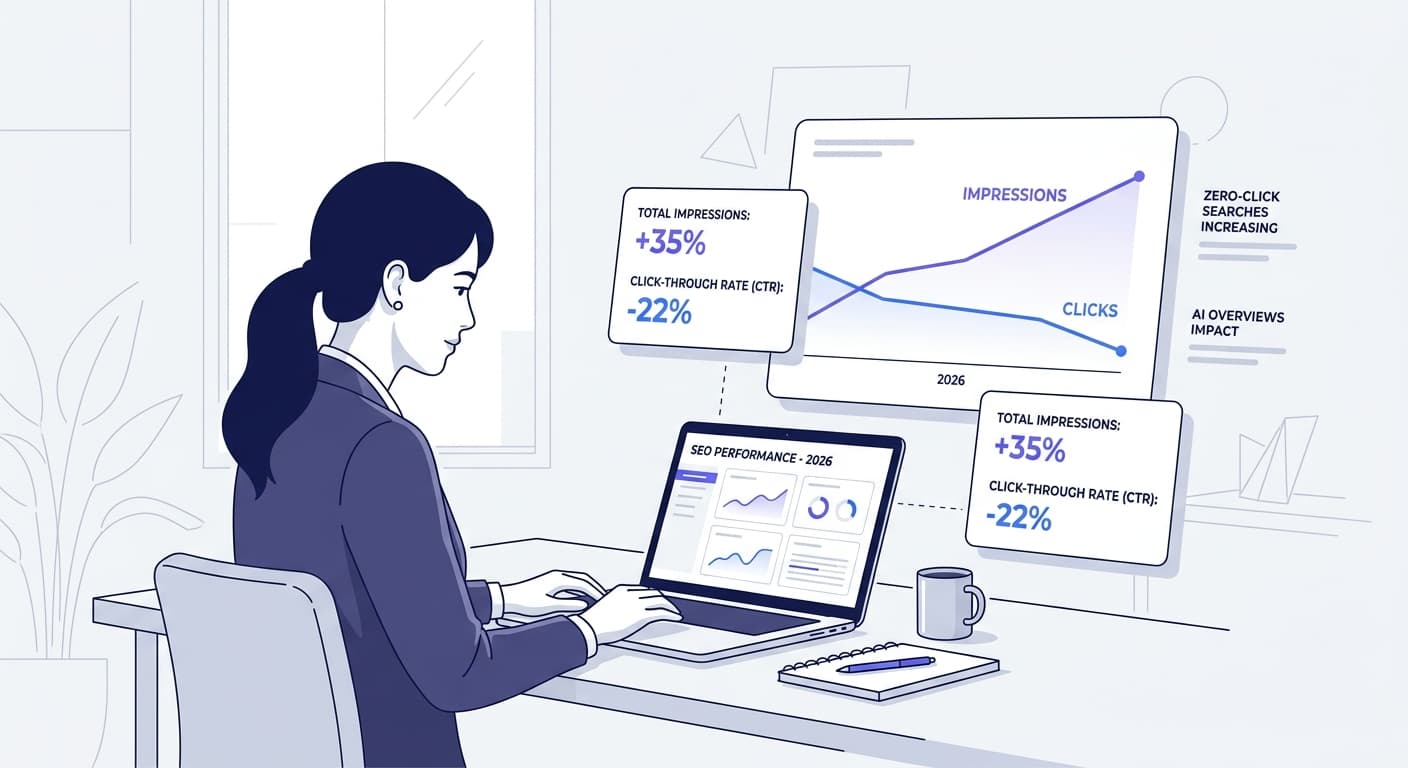
CTR remains an indicator of the strength of your listing, but dropping CTR does not necessarily indicate low-quality optimization. In 2026, a falling CTR can also signal that AI features are absorbing clicks before users reach your result.
Average Position
In the Performance report, GSC gives you an aggregated position. It is not a single fixed rank, but an average across different contexts (device, country, result type). Treat it as a trend indicator, not an absolute truth for one specific query.
The most frequent mistake is confusing average position with the actual ranking for each individual query. Average position is a trend indicator, not an exact measure.
How to Read the Performance Report Like a Pro
The Performance report is where most SEO professionals spend the majority of their GSC time. It contains the data that drives strategic decisions about content creation, technical optimization, and keyword targeting. Understanding how to filter, segment, and interpret this data is essential for effective SEO in 2026.
The "Striking Distance" Filter
One of the highest-ROI moves in GSC is hunting for "striking distance" keywords — pages nearly on page one that a targeted push can lift significantly.
Cross-reference average position with CTR to find quick wins — pages at positions 5–15 with solid volume are your best opportunities.
Queries ranking between positions 8 and 20 often offer quick wins. Filter these segments, verify page relevance, then enrich or structure the content further to target the top of the first page, where exposure gains are greatest.
Use QuickSEO's keyword density checker to ensure your striking-distance pages are sufficiently optimized for their target queries before pushing for a ranking lift.
Segmenting for Meaningful Insights
Unsegmented GSC data is noise. The signal comes from drilling down. Segmentation turns average position into an operational tool. Without it, you are managing noise; with it, you can identify practical levers. By query, you can spot high-volume terms with weak CTR. By page, you can detect strategic URLs that are declining. By country, you can isolate a localized issue. By device, you can confirm mobile vs desktop differences.
A practical segmentation workflow:
Filter by device — compare desktop vs mobile CTR for the same pages
Filter by country — isolate performance in your core markets
Filter by date comparison — compare the last 28 days to the prior period to catch trends early
Filter by search type — separate Web, Image, Video, and Discover data
Always ensure you are in the correct search type tab before interpreting performance data — mixing Web and Discover data produces misleading averages.
Diagnosing the Impressions vs. Clicks Gap
The discrepancy between impressions and clicks signals an opportunity for targeted optimization. By analyzing culprit pages, aligning content with user intent, enhancing snippets, and structuring CTAs, visibility can be effectively converted into engagement and pipeline impact.
Common causes of the impressions-clicks gap in 2026:
AI Overviews absorbing informational queries before the click
Featured snippets answering questions at the SERP level
Title/meta mismatch — your listing doesn't match user intent
Poor ranking position — position 5+ significantly depresses CTR
Low CTR + good ranking = messaging issue. Low impressions + good CTR = visibility issue.
To fix messaging issues, consider using QuickSEO's SERP preview tool to see exactly how your title and meta description appear in search results before making changes.
Interpreting Average Position: The Nuances That Matter
Average position is perhaps the most misread metric in GSC. Here's how to interpret it accurately.
Position Is Impression-Weighted
Average position in Google Search Console is the impression-weighted average order in which your results appeared. It is useful for tracking trends, but it can hide situations where one highly visible query offsets deterioration across many secondary queries.
If you expand semantic coverage, you can win more clicks from positions 2–5 whilst also generating more long-tail impressions (positions 15–30). That can actually reduce the average position even as traffic grows. In other words — a worsening average position number can coincide with more clicks and more revenue. Always check the full picture.
The Position-CTR Relationship in 2026
SERP formats strongly influence CTR at any given position. A textual position 1 can drive more or fewer clicks depending on whether there is an optimised snippet, a video carousel, or an AI module present.
Involving dynamic SERPs, AI blocks, and mixed types of results, a position of 3 does not imply that it will be seen above the fold.
Reading Position Drops Correctly
When average position drops, don't panic — diagnose first:
Position down + impressions stable: competition or SERP evolution.
Position down + impressions down: relevance loss or indexing issues.
Position stable + CTR down: a new SERP feature (like an AI Overview) has been inserted above your result
Prioritize pages already in the top 10 with high impressions and disappointing CTR, then validate success through combined movement in impressions + CTR + clicks, not average position alone.
The Indexing (Coverage) Report: Reading Every Status
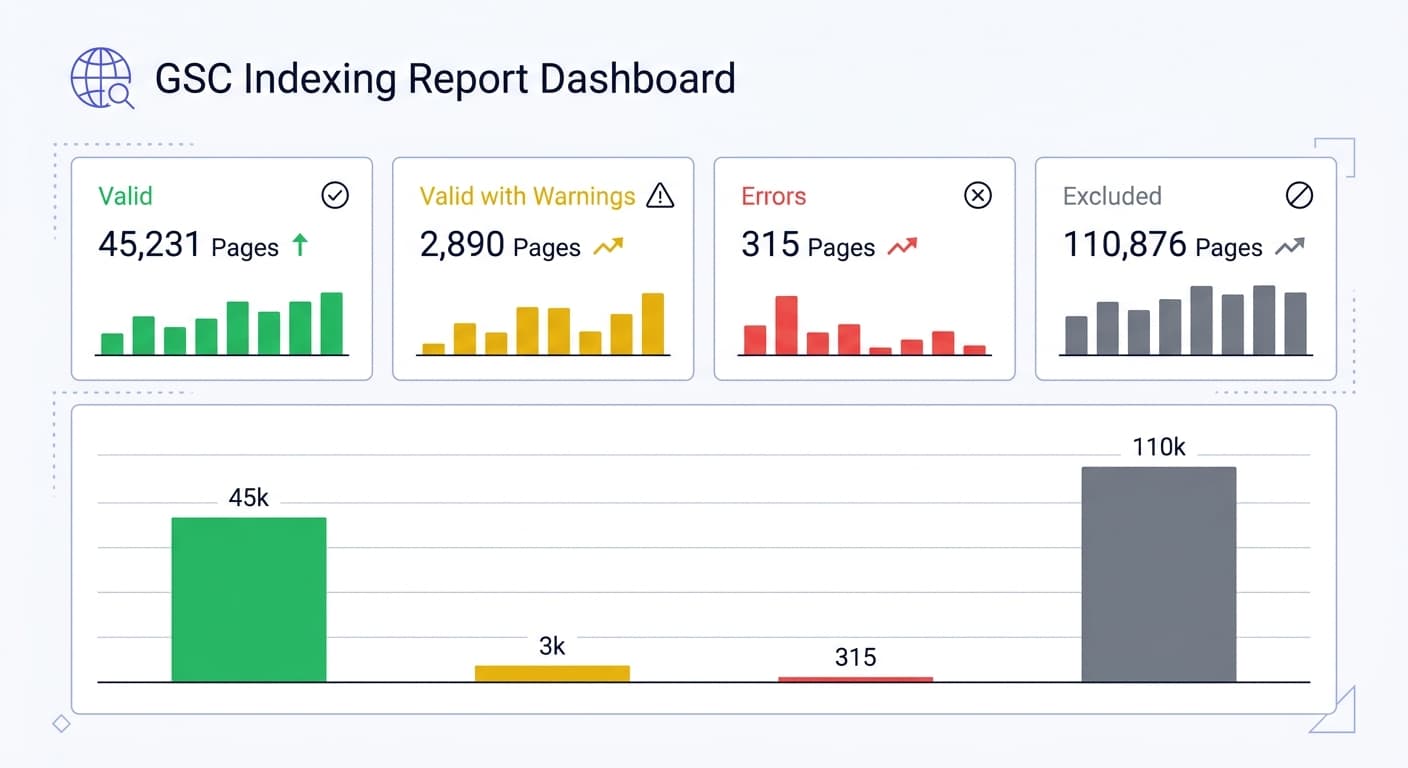
The Pages Report (formerly Coverage Report) inside Google Search Console is a site-wide view of every URL Google has discovered for your website and its indexing status. It categorizes all discovered URLs into four groups: Error (pages that could not be indexed due to a technical problem), Valid with Warning (indexed but with a flag), Valid (successfully indexed), and Not Indexed (excluded for various reasons).
The "Crawled – Currently Not Indexed" Status
This is the status that trips up most SEO teams. Google visited the page but decided not to index it.
This is a content or quality signal — Google evaluated what it found and decided the pages did not meet the threshold for indexing. Common causes are thin content, pages too similar to other indexed pages on your site, or content that does not offer anything beyond what already exists in Google's index. This is the status that requires the most honest content evaluation.
Since early 2024, Google has become noticeably stricter about what it considers worth indexing, with a greater emphasis on content that offers genuine unique value. Review the affected pages honestly — if they cover the same ground as other indexed pages on your site without adding meaningful differentiation, consolidation or significant improvement is the right fix.
Error Status: Your Highest Priority
Error pages are your highest priority items. These are actively failing — Google tried to crawl or index them and hit a blocking issue. Every page in this category is invisible in Google Search and will remain so until the underlying error is resolved.
Common errors include server errors (5xx), 404 Not Found, redirect errors, and 403 Forbidden responses.
Use QuickSEO's bulk status checker to quickly verify HTTP response codes across large sets of URLs identified in your GSC coverage report.
"Discovered – Currently Not Indexed"
This means Google knows the URL exists but hasn't prioritized crawling it yet. Common causes: low perceived value, duplication, weak internal linking, or crawl prioritization issues.
Fix approach: strengthen internal linking to these pages, improve content depth, and consider whether the pages serve a genuinely unique purpose.
The "Indexed, Though Blocked by Robots.txt" Warning
The most common warning is "Indexed, though blocked by robots.txt," which means Google indexed the page despite your robots.txt suggesting it should not crawl it. This is not as contradictory as it sounds — robots.txt blocks crawling, not indexing, and Google can index a URL it discovers through links even if robots.txt tells it not to crawl.
Triage Philosophy: Not Every "Not Indexed" Page Is a Problem
The right approach is simple: make sure your important pages are indexed, investigate anything genuinely stuck, and ignore the rest. You don't need every page indexed. You need the right pages indexed.
GSC in the Age of AI Overviews
As of 2026, Google Search Console integrates AI Overview and AI Mode data into the standard Performance report. When your content appears in an AI Overview or AI Mode result, you'll see impressions counted when the result is scrolled into view or expanded, and clicks counted when users click through to your site from the AI-generated summary.
This creates a new interpretation challenge. For queries where you rank positions 1-3 but have unusually low CTR, AI Overviews may be answering queries without requiring clicks. Increasing impressions without proportional click increases may indicate AI feature presence.
How to Spot AI Overview Impact in Your GSC Data
Look for these patterns in your Performance report:
High impressions, declining CTR on informational queries (how-to, what-is, definition queries)
Position 1-3 with sub-2% CTR — a strong sign that an AI Overview is dominating the SERP
Question-based queries with strong impression growth but flat or declining clicks
Three forces have made GSC indispensable in the current search landscape: AI Overviews require machine-readable content. With Google's AI-generated summaries now appearing above organic results for hundreds of millions of queries, structured data errors visible only in GSC's Enhancements tab can quietly exclude your content from consideration.
A note on data integrity: a permanent correction was applied on April 3, 2026, after GSC had been over-reporting impressions. While seeing a "drop" in impressions can be jarring, this adjustment reflects more accurate data. If you're comparing 2025 data to 2026 data, flag the period May 2025–April 2026 as "inflated" in your reporting tools.
The Link Reports: Underused Gold
GSC's link reports give you a clear picture of your site's authority distribution, both from external sources and within your own structure. The External links report shows which domains link to your site most, your most-linked pages, and the most common anchor texts. This can be a valuable source of backlink data without paid tools.
The Internal links report shows which URLs receive the most links from within your own site. Pages with more internal links concentrate more PageRank, making this report essential for optimizing your site structure.
For a deeper internal link analysis beyond what GSC natively provides, QuickSEO's internal linking audit tool maps your site's full internal link graph and surfaces orphaned pages, anchor text distribution issues, and crawl depth problems.
Core Web Vitals: The Experience Signal
The Core Web Vitals report in GSC shows how your pages perform on Google's three user experience metrics — LCP, CLS, and INP — using real-world data collected from Chrome users visiting your site (called CrUX data). This data directly informs Google's page experience ranking signals.
This is field data — actual measured user experience — as opposed to lab data (Lighthouse scores from a simulated test environment). Google's Page Experience ranking signals use field data, making the GSC CWV report the authoritative source for understanding how real users experience your site's performance.
Key interpretation tip: the CWV report groups URLs by similarity (URL clusters) rather than listing every individual URL. A single CWV failure might represent hundreds of pages that share a template. Fix the template, fix all of them simultaneously.
Common GSC Interpretation Mistakes (and How to Avoid Them)
Even experienced SEOs misread GSC data. Here are the most frequent errors:
1. Treating average position as absolute truth Position is an impression-weighted average. The same URL can appear at very different ranks depending on the context: mobile vs desktop, query variations, or SERP features.
2. Panicking about "Not Indexed" pages Many excluded URLs are intentionally or appropriately excluded (redirects, canonicals, parameter URLs). Many of those exclusions are normal — redirects, canonicals, and pages that simply shouldn't be in search.
3. Optimizing CTR without considering query type Another mistake is focusing on CTR without considering query type. A navigational query for your brand name will always have high CTR; a broad informational query may naturally attract low CTR regardless of how good your snippet is.
4. Ignoring the "Crawled – Not Indexed" signal This status is Google's polite way of saying your content wasn't worth indexing. Do not just request indexing on these pages — read them with fresh eyes and ask whether they genuinely serve a searcher better than existing indexed alternatives.
5. Forgetting to segment before analyzing Average position aggregates different realities: depending on country, device or query diversity, the same page can rank at the top of the SERP for certain segments and much lower for others. Without segmentation, you risk missing pockets of exploitable performance.
Building a Weekly GSC Workflow
Turn GSC from a reactive panic tool into a proactive growth engine with this weekly review cadence:
Every Monday (15 minutes):
Check for new errors in the Pages (Coverage) report
Scan for any dramatic drops in total clicks or impressions vs. prior week
Review Core Web Vitals for new "Poor" URLs
Every Wednesday (20 minutes):
Filter Performance report for queries at positions 5–15 with >500 impressions
Identify pages where CTR dropped >20% week-over-week
Check the internal links report for newly orphaned pages
Monthly (45 minutes):
Export query data to a spreadsheet and look for seasonal patterns
Identify queries with growing impressions but flat clicks (content refresh opportunities)
Review the Links report for new external linking domains
Regular, systematic GSC monitoring allows you to: identify and fix indexation problems before they suppress traffic, spot ranking opportunities (keywords ranking positions 6-20 that a content update could push to page one), catch manual penalties before they compound, monitor Core Web Vitals performance, and submit new content for faster indexation.
GSC vs. GA4: Know Which Tool Answers Which Question
A common source of confusion is conflating GSC and Google Analytics 4. They answer fundamentally different questions.
GSC answers: "How do people find you on Google Search, and how does Google understand your site?" GA4 answers: "What do people do after they land on your site?" — engagement, events, conversions, and journeys.
Use them together: GSC identifies which pages are winning impressions and clicks; GA4 tells you what those visitors do next and whether they convert.
🚀 Track Your Search AND AI Visibility in One Dashboard
GSC shows you how you're performing in Google Search — but in 2026, half the battle is being visible in ChatGPT, Claude, Gemini, and Perplexity too. QuickSEO gives you one unified dashboard to monitor your clicks, impressions, and CTR from Google Search Console alongside your AI visibility scores across every major AI chatbot. Track which prompts mention your brand, see your share of voice against competitors, and get actionable insights — all in one place. Thousands of marketers are already tracking their full search + AI performance with QuickSEO. Start for free at quickseo.ai →
Conclusion: Data Is Only as Valuable as Your Interpretation
GSC is one of those tools that feels "basic" until you realize it's literally Google telling you what it sees — and what it can't. In 2026, with search becoming more AI-shaped, your technical foundation and clarity of content matter even more.
The marketers who win in this environment aren't the ones with the most data — they're the ones who ask the right questions of their data. Is this CTR drop a messaging problem or an AI Overview insertion? Is this indexing exclusion a content quality issue or a technical error? Is this position improvement meaningful, or am I winning on low-volume long-tails while losing on the queries that matter?
Use the frameworks in this guide to move from data consumer to data interpreter — and watch your GSC sessions turn from passive check-ins into active growth levers.
For a deeper look at how AI is reshaping what GSC data means for your strategy, explore our guide on search visibility trends in 2026 and what it means to optimize for both Google and AI chatbots simultaneously.
Enter your website to track its AI visibility across ChatGPT, Gemini, Claude, and Perplexity — and turn chatbot mentions into traffic.
- Set up in minutes
- Cancel anytime
Keep reading
Related posts
More articles on the same topics, prioritized by shared tags and keyword overlap.


